Chapter 4
Voice Multiplicity and Emotion Perception
Abstract
Three experimental studies investigated how the number of musical voices in a passage—the music's voice multiplicity—influences the perception of musical emotions. Brief (5s) extracts from polyphonic keyboard works by Johann Sebastian Bach were chosen to represent conditions of one, two, three, or four concurrent musical voices, and listeners rated each for their perceived emotional content. In general, denser polyphonic textures were associated with more positive emotional valence. While this effect generalized to a broad range of positive and negative emotions, it appeared not to depend on whether an emotion connoted social situations. In a polyphonic voice denumeration task using the same stimuli, response patterns corresponded closely with emotion ratings, suggesting a single musical feature or percept might play a role in both. Aspects of voice numerosity—the subjective impression of the number of voices present in music—are discussed. Biological origins for the observed effect are proposed.
Introduction
It has long been speculated that music is expressive of emotion in ways similar to the speaking voice (Rousseau, 1782; Spencer, 1857; Helmholtz, 1863; Kivy, 1980). More recent empirical evidence has indicated that emotion cues in music and speech overlap considerably (Juslin & Laukka, 2003; Ilie & Thompson, 2006; Thompson, 2012), and many musical features are reliably associated with specific emotions (see Gabrielsson & Lindström, 2010; Gabrielsson & Juslin, 2003). Nonetheless, explanations by simple analogy or homology to speech cannot easily account for all musical situations. A great deal of music does not come from a single voice, and instead reflects the coordinated effort of many musicians performing simultaneously (see, e.g., Merriam, 1964; Blacking, 1973; Nettl, 2005). Indeed, unaccompanied melodies seem to represent only a fraction of the music typically encountered, while most music heard today features multiple simultaneous musical parts, lines, or accompaniments. If musical emotions are perceived in part because musical and linguistic emotion cues coincide, then how do listeners perceive emotion in music that resembles more than one voice?
Relatively few psychological studies of musical texture and emotion appear to have been conducted, and those that have been published have produced conflicting results. Kastner and Crowder (1990) asked children aged three to twelve to respond to both monophonic and block-chord accompanied melodies by pointing to drawings of faces depicting positive and negative emotions. Overall, unaccompanied stimuli appeared to be perceived more positively than accompanied stimuli.1 A similar correspondence was identified by Webster and Weir (2005) using four-part harmonizations. In their study, undergraduate participants consistently rated nonharmonized melodies as happier than harmonized melodies for both major and minor stimuli using a continuous scale.
Nonetheless, other research has produced precisely the opposite response pattern. In an attempt to replicate Kastner and Crowder (1990), Gregory, Worrall, and Sarge (1996) asked both children and adults to identify accompanied and unaccompanied melodies as sounding either happy or sad. Unaccompanied melodies in fact sounded less happy than accompanied melodies, contradicting the earlier result. Similar results were obtained by McCulloch (1999), whose research also suggested that accompanied melodies are perceived more positively than unaccompanied melodies.
The lack of consensus regarding the emotional effects of textural density potentially reflects the different versions of dense textures used in these studies. Kastner and Crowder (1990) employed block chords played on the piano, and Webster and Weir (2005) appear to have used basic chorale-style harmonization. McCulloch (1999) used accompaniments taken from published songbooks, and Gregory et al. (1996) appears to have done the same. One could imagine several musical features which might have differed between these harmonized or accompanied dense textures. The present study will diverge from these previous approaches by using contrapuntal polyphonic stimuli of four different levels of textural density. Hopefully, our results will provide a helpful third perspective.
Approaches to Musical Texture
When describing different textures, musicians often refer to relationships between musical parts, or voices. In this context, a 'musical voice' does not necessarily need to be sung, but instead can refer generically to any horizontal musical line. As a result, the relationship between the number of musical voices and the number of performers is not always one-to-one: many complex arrangements are possible (Cambouropoulos, 2008). A monophonic texture could arise both from a single person chanting or from several instrumentalists performing in unison. Similarly, polyphonic music with multiple musical voices could be performed by a single musician using a polyphonic instrument.2 While polyphony in the broadest sense can refer to any music with more than one simultaneous note, it also can be used in a more specific sense to designate contrapuntal textures with a high degree of independent linear motion (such as occurs in canons, fugues, and Renaissance motets).
In addition to monophony and polyphony, several other types of texture have been identified by music theorists. Homophonic music employs a texture based on chords: many different notes appear at once, but their rhythms are aligned, as in traditional chorale settings (Clendinning & Marvin, 2005; Laitz, 2012). Some have identified 'heterophony' as a distinct texture in which a single melody is simultaneously presented in multiple variations (Cooper, 1981). Berry (1976) adopted an open-ended interpretation of musical texture, accommodating many different intervallic, rhythmic, and melodic components. Dimensional approaches have also appeared: Huron (1989a) describes monophony, polyphony, homophony, and heterophony as four regions in a two-dimensional texture space, representing different degrees of semblant motion and onset synchrony.
The present study investigates the perception of musical emotion in terms of musical voice multiplicity: the number of musical parts or voices simultaneously present in a texture. Because our primary goal was to measure a purely musical effect (and not one which would actually reflect the number of musicians performing), we used stimuli performed by a single person on a polyphonic instrument. A straightforward definition of musical voice was adopted: the number of notated musical lines specified by the composer of contrapuntal works.
Because the voice multiplicity of a piece of music might implicitly or explicitly designate certain social settings, we conjectured that listeners would be more likely to perceive musical emotions corresponding to the musical texture's social connotation. Specifically, we hypothesized that music with fewer polyphonic voices would be expected to sound lonelier than music with many voices. This hypothesis was inspired by recent exploratory research on musical affect: Albrecht's (2012) complete surface-level affective analysis of the slow movement from Beethoven's Sonata No. 8, Op. 13 ("Pathétique"). In Albrecht's 'progressive exposure' paradigm, over two hundred listeners were asked to judge the emotional content of five-second excerpts representing the entire duration of the movement. One of the rated emotions, loneliness, appeared to show sensitivity to the number of musical voices present (see Figure 1). Note that the present hypothesis that thin textures should sound more lonely runs somewhat contrary to Webster and Weir (2005) and Kastner and Crowder (1990), who reported that monophony tends to be associated with increased positive affect over harmonized (multivoice) textures.
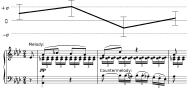
In our first experiment, participants rated several brief musical excerpts for four emotions, including perceived loneliness. We predicted that music with fewer musical voices would tend to sound lonelier than music with many musical voices. A second experiment tested whether voice multiplicity effects generalize to emotional valence and sociality. Finally, a third experiment allowed subjects to generate their own emotion labels and directly measured their ability to denumerate the voices in the specific stimuli used. To anticipate our results, perceptual loneliness will exhibit a voice multiplicity effect in which higher voice multiplicity corresponds to less perceived loneliness in polyphonic music. This effect appears to apply more generally to several positive and negative emotions. In general, response patterns for perceived emotion will bear a strong resemblance to the perceived number of musical voices present, suggesting that they might derive from the same underlying cues.
Experiment 1: Perception of Musical Loneliness
Our conjecture that textures with fewer voices should sound more lonely implies that listeners form some perceptual or cognitive representation of the number of voices present. We shall refer to this proposed subjective representation as the perceived voice numerosity of a piece of music.3 The distinction between voice multiplicity and voice numerosity (presuming it exists) reflects the division between external acoustic sound sources and internal auditory percepts, similar to that between amplitude and loudness, or frequency and pitch. Note that music's voice numerosity need not match its nominal voice multiplicity: perceptual errors could be made. In this case, perceived musical loneliness would be expected to reflect subjective voice numerosity, including any perceptual errors that might have arisen.
As a subjective psychological construct, voice numerosity cannot be directly measured. However, an indirect measure could be used: performance on a voice denumeration task, in which a listener reports the number of voices present in a polyphonic texture. Voice denumeration appears to be subject to certain limitations. While listeners are quite accurate in identifying one-voice and two-voice textures, they increasingly underreport the voices present in denser textures (Huron, 1989; Parncutt, 1993). In fact, Huron's listeners reported four-voice textures as having only three voices more often than they answered correctly (see Table 1). It would therefore appear that as polyphonic textures grow denser, voice multiplicity levels become less perceptually distinct.4 Presuming these voice denumeration results reflect perceptual voice numerosity, we additionally made the prediction that perceived loneliness should change more between one- and two-voice textures than between three- and four-voice textures.
Stimuli
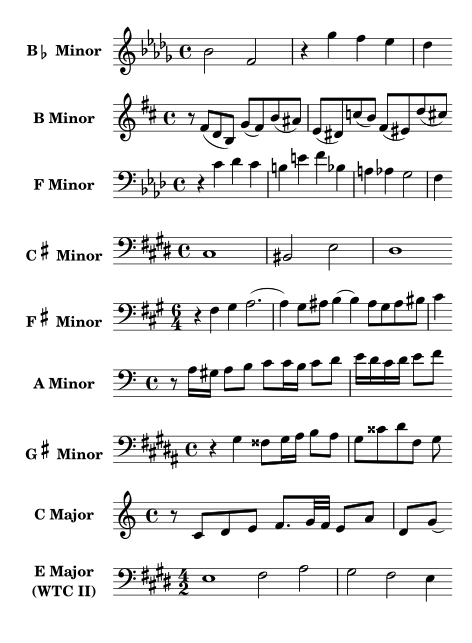
Fugal compositions were chosen because they feature polyphonic textures with clearly defined voice multiplicities. Fugues typically begin with a single monophonic melody: the fugue's subject. Additional voices then accumulate, with each new entry repeating the subject melody. By excerpting from fugue expositions, sets of stimuli matched for melodic content, tempo, and other composition-specific features can easily be generated. Accordingly, we chose fugues from J. S. Bach's Well-Tempered Clavier, which includes one fugue in each of the 24 major and minor keys (Bach, 1722). Recordings by a professional harpsichordist playing a 1624 clavecin were used (Verlet, 1993). Because the harpsichord's plucking mechanism results in relatively uniform intensity, articulation, and timbre across its range, performers have limited ability to highlight certain musical voices over others.
Because loneliness is a negatively-valenced emotion, we expected it would be most perceived in minor-mode pieces of music. Hence, all minor-mode fugues of at least four voices were identified. For each, the beginning and ending of each statement of the fugal subject was marked, and 5s excerpts from the center of each multiplicity region were generated, including 200ms logarithmic fade-ins and fade-outs. The G minor fugue was excluded because its exposition does not include stepwise accumulation of voices, and fugues without 5 contiguous seconds for each multiplicity were also excluded. This left seven minor-mode fugues with four isotextural multiplicity conditions each. Two major fugues from the same recording were additionally sampled in order to increase the modal diversity of the stimuli. Ratings for major-mode stimuli were not analyzed in the first experiment.
Procedure
Twenty-eight Ohio State University School of Music undergraduates enrolled in sophomore-level aural skills classes participated for course credit (17 female, 11 male, aged 19–21). Participants were asked to provide emotion ratings for randomly-ordered musical excerpts played through free field speakers at a comfortable level. All trials took place in an Industrial Acoustics Corporation sound-attenuation chamber.
In addition to loneliness, three other emotions were rated to disguise the target emotion, as well as to provide data for exploratory analysis. Subjects rated the prototypical negative and positive emotions of 'sadness' and 'happiness', and 'pride' as a socially-relevant positive emotion. Participants were instructed to rate the emotions they perceived in the music (not necessarily the emotions they might themselves experience). Each randomly-ordered trial presented the prompt: "How [emotion] does this music sound?" Responses were collected using a continuous slider interface labeled only on the left and right as "not at all [emotion]" (scored as 1.0) and "very [emotion]" (scored as 7.0). After each rating, the slider was reset to the center position (4.0). After 5 practice trials, participants rated all 144 stimulus-emotion combinations in random order. A second block of 72 randomly-selected stimulus-emotion pairs immediately followed, used to gauge the reliability of emotion ratings. Post-experimental interviews were conducted to check for demand characteristics and explore strategies used.
Results
Across all repeated subject-stimulus ratings for loneliness, the test-retest correlation was rs = .65, and the average difference in rating was unbiased. A 95% confidence interval around the difference in rating was calculated to be (−0.15, 0.14). Hence, duplicate measurements were averaged prior to further analysis in order to increase analytic precision.
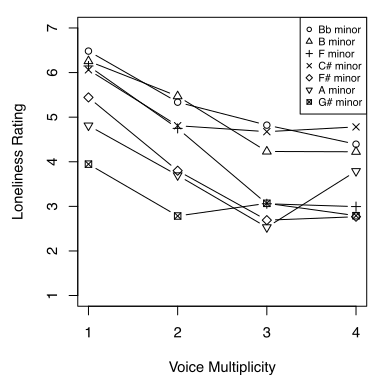
Figure 3 shows median loneliness ratings for each minor fugue in the study, as affected by voice multiplicity condition. In general, loneliness ratings decrease as voice multiplicity rises, regardless of fugue. On average, listeners rated a given fugue's one-voice condition as 1.89 points lonelier on a 7-point scale than its four-voice presentation, t(27) = 8.71, p < .001, consistent with the first hypothesis. A second hypothesis predicted that loneliness ratings would decline the least between three- and four-voice conditions, reflecting these textures' supposed phenomenological similarity (as suggested by voice denumerability limitations). On average, listener ratings dropped 0.99 points more between one- and two-voice conditions than between three- and four-voice conditions, t(27) = 5.21, p < .001. This result is consistent with the idea that loneliness ratings and voice denumeration are both mediated by perceptual voice numerosity.
Other Emotions
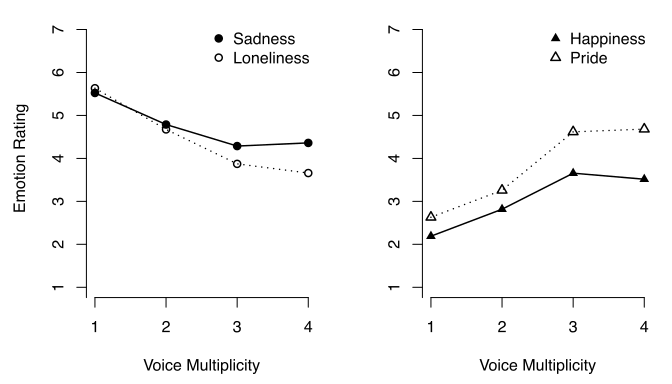
The effects of voice multiplicity on the perception of happiness, sadness, and pride were also explored (Figure 4). The positively-valenced emotions happiness and pride both exhibited increased ratings for higher voice multiplicity, while ratings for the negatively-valenced emotions of sadness and loneliness showed the opposite effect. It would appear that the positive/negative valence of an emotion might dictate the direction of the relationship. Additionally, the effect of voice multiplicity on ratings for the tested social emotions (loneliness and pride) appears to be stronger than for the nonsocial emotions (sadness and happiness). Comparing the effect on sadness to that on loneliness, a post hoc statistical test revealed that a user's difference in emotion ratings between one- and four-voice textures is 0.65 points greater for loneliness than for sadness, t(27) = −3.09, p = .003. The same result is found for positively-valenced emotions: pride ratings changed 0.46 points more than happiness ratings (t(27) = 2.55, p = .009). That social emotion perception would be more strongly affected by voice multiplicity than nonsocial emotions suggests that a social setting might somehow be inferred by listeners. Experiment two will test this hypothesis explicitly (but fail to find corroborating evidence).
Strong Ratings of Musical Emotion
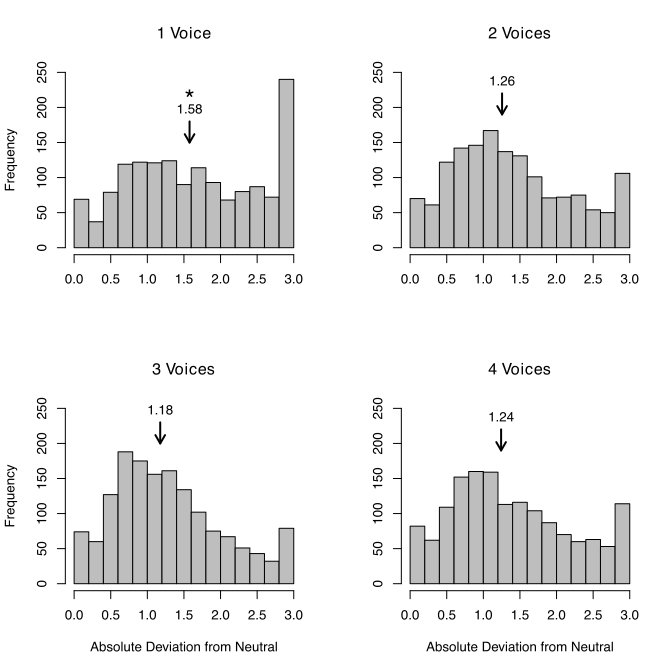
So far, ratings have been treated as being measureable from the scale's 'zero' point ('not at all [emotion]'). However, an alternate interpretation would consider ratings as directed deviations from the slider's center point. Viewed this way, emotion ratings seem to be more neutral when more voices are present, and stronger for lower voice multiplicities (see Figure 4). To explore this idea, the strength of each emotion rating was calculated by measuring its absolute deviation from the scale's midpoint (4.0). Histograms of absolute rating strength were prepared for each voice multiplicity (Figure 5). Results of six post hoc Mood median tests suggested that the monophonic texture's median rating strength was higher than each of the other three (p < .0001 for every comparison), while other comparisons were statistically nonsignificant. In other words, emotion ratings in experiment one appear to have been particularly strong for monophonic stimuli.
Discussion
The first experiment provided evidence consistent with the experimental hypotheses, suggested possible generalizations of the effect to emotion valence and sociality, and implied that the strength of emotion ratings might depend on voice multiplicity.
First, the experimental results are consistent with the idea that lower voice multiplicities increase the tendency to perceive musical loneliness. Post-experimental interviews corroborated this finding, as many participants reported that textural density informed some emotion judgments. Moreover, the effect appears to correspond with perceptual limitations on voice denumerability: voice multiplicity effects arose predominantly between one-, two-, and three-voice conditions. We interpret this to implicate perceptual voice numerosity as mediating emotion perception differences. While it is possible that one or more musical variables apart from voice multiplicity could also explain the results (such as event density or complexity), such concomitant changes in the musical surface might themselves serve as voice multiplicity cues. This idea will be addressed in the general discussion to follow.
Second, the results raise the possibility that voice multiplicity effects might generalize to many emotions based on their valence (positive or negative), their sociality (social or nonsocial), or both. However, another plausible interpretation would be that these apparent effects are simply due to a demand characteristic. Each participant rated all four emotions, and several expressed awareness of the 2 × 2 design in post-experimental interviews. To address this issue, our second study attempted to replicate these results using a between-subjects design with many exemplars of each emotion category.
Finally, post hoc analysis indicated that emotion ratings might have been stronger when only a single voice was present in the music. This suggests that monophonic and polyphonic textures might differ qualitatively, at least in regard to perceived emotion. To anticipate the results of studies two and three, the finding that monophonic stimuli reliably evoke stronger emotion ratings will be replicated for many experimenter-supplied emotions, but not for emotions that participants themselves volunteer.
Experiment 2: Generalization to Emotion Valence and Sociality
While results of experiment one suggest that voice multiplicity might influence perceived emotion ratings in interaction with emotional valence and sociality, the initial study design introduced a possible demand characteristic. This second experiment provides an explicit test for these effects. A between-groups design was used with regard to valence, and within each valence group, three social and three nonsocial emotions were chosen.5 In all, three hypotheses were tested: First, positive emotion ratings should increase, and negative emotion ratings should decrease as voice multiplicity rises. Second, social emotions should exhibit larger-magnitude voice multiplicity effects than nonsocial emotions. Third, we hoped to reproduce the result that monophonic stimuli evoke stronger responses than any other multiplicity level.
Categorizing emotions into 'social' and 'nonsocial' types draws on experimental evidence from developmental studies (Stipek, 1990; Kagan, 1981) and more recently, functional neuroimaging (e.g., Burnett, 2009). Experiencing certain emotions—such as pride, shame, guilt, embarrassment, and envy—depends on the ability to model the mental states of oneself and others. These emotions have been variously referred to as social emotions (Teroni, 2008; Minzenberg, 2006), self-conscious emotions (Lewis, 1989; Tracy, 2007), or moral emotions (Eisenberg, 2000; Tangney, 2007). Social emotions often overlap with so-called 'secondary emotions,' distinguishable from the 'primary' or 'basic emotions' which appear early in life (Lewis, 1983), and have cross-culturally recognizable facial expressions (Ekman, 1973). Both loneliness (Weiss, 1975; Cacioppo, 2008) and pride (Tracy, 2007b; Williams, 2008) have been described as social emotions.
Although we interpreted the results of Experiment 1 as suggesting an effect due to sociality, emotions like loneliness and pride could also be distinguished from sadness and happiness by other factors, such as categorical prototypicality (Rosch, 1973, 1975; Lakoff, 1987), or familiarity (Zajonc, 1968; Bornstein, 1989). In order to choose a well-stratified collection of emotions, we made use of the hierarchic analysis of Shaver et al. (1987), who clustered 135 emotions into categories and subcategories using results of a sorting task. Six positive and six negative emotions were chosen such that no two emotions fell in the same subcategory (see Table 2). Shaver et al. (1987) also provided subjective ratings of the emotions' prototypicality: the degree to which listeners consider it to be an emotion. To estimate each emotion word's familiarity, its frequency ranking in the Corpus of Contemporary American English was found (Davies, 2008). These two covariates would be used for post hoc exploratory analysis.
| Valence Group | Sociality | Emotion | Prototypicality | Frequency |
|---|---|---|---|---|
| Positive | Social | Pride | 3.14 | 13,805 |
| Love | 3.94 | 153,466 | ||
| Compassion | 3.62 | 5,461 | ||
| Nonsocial | Happiness | 3.77 | 8,177 | |
| Contentment | 2.92 | 796 | ||
| Excitement | 3.51 | 9,231 | ||
| Negative | Social | Shame | 3.44 | 9,319 |
| Loneliness | 3.41 | 3,121 | ||
| Envy | 3.58 | 3,355 | ||
| Nonsocial | Sadness | 3.68 | 4,734 | |
| Fear | 3.83 | 49,410 | ||
| Disgust | 3.42 | 2,879 |
Stimuli and Procedure
Sophomore-level music students aged 19–21 participated for Aural Skills course credit. Participants were alternately assigned to the positive-emotion (N = 18) or the negative-emotion group (N = 19) in the order in which they arrived. Using identical slider interfaces as in the first study, the positive-emotion and negative-emotion groups rated identical stimuli for the emotions given in Table 2, in randomized order. Because the major-mode and minor-mode excerpts did not appear to elicit different response patterns, results for all 36 stimuli were analyzed together (7 minor fugues and 2 major fugues with four voice multiplicity conditions).
Results and Discussion
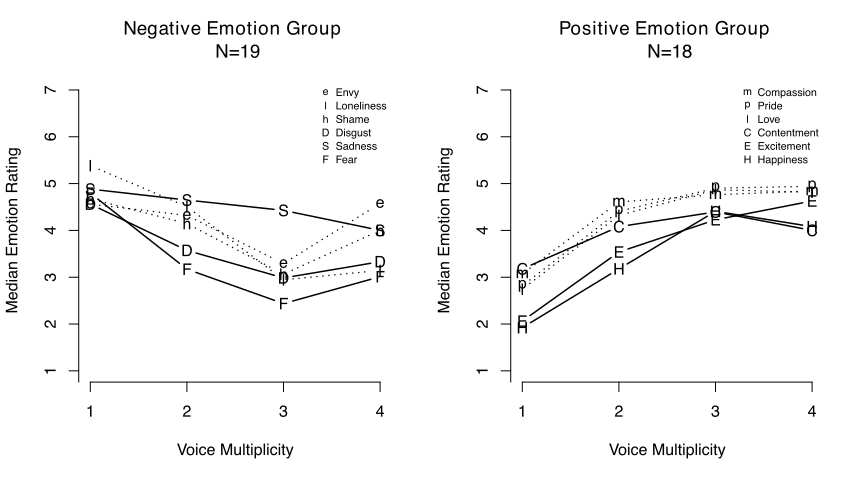
Results for the positive and negative emotion groups are compared in Figure 6. It is clear that positive and negative emotion ratings responded in opposite directions to increasing polyphonic voice multiplicity. The mean difference in emotion rating moving from monophonic to four-voice music was −0.83 for the negative emotion group (t(18) = 6.10, p < .001) and +1.44 for the positive emotion group (t(17) = 12.19, p < .001). In fact, all twelve emotions responded in the expected direction, with positive emotion ratings increasing with voice multiplicity and negative emotion ratings decreasing. In short, it seems that thinner polyphonic textures are associated with negative emotional valence and thicker textures with positive emotional valence. Once again, the effect appeared to taper off as multiplicity rose.
To test for an effect of emotion sociality, two-way mixed models were fit to the responses of each the positive and negative emotion groups, using multiplicity and sociality to predict emotion ratings, blocking by both subject and fugue.6 The hypothesis that social emotions would respond more strongly than nonsocial emotions would predict that an interaction between voice multiplicity and sociality should be present. To control for multiple tests, p values below .01 were treated as statistically significant, for a familywise error rate under .06.
Main effects were identified for voice multiplicity (considered linearly) in both the negative and positive groups, with higher multiplicity associated with lower negative emotion ratings, χ²(1) = 183, p < .001, and higher positive emotion ratings, χ²(1) = 556, p < .001. Additionally, a main effect was found for emotion sociality in the positive emotion group (χ²(1) = 129, p < .001); social positive emotions got higher ratings than nonsocial positive emotions overall. However, no significant interaction effect between voice multiplicity and emotion sociality was found for either emotion valence group, failing to support the hypothesis that social emotion perception ought to depend on multiplicity more strongly than nonsocial emotion perception. (χ²(1) = 0.18 for negative emotions; χ²(1) = 0.91 for positive emotions)
A post hoc reanalysis using the assembled emotion prototypicality and frequency covariates instead of sociality indicated that emotion ratings did not depend on prototypicality, but might have depended on an emotion term's frequency of occurrence. Specifically, positive emotions were rated higher when the word was more frequent (χ²(1) = 10.1, p = .002) and negative emotions were rated lower (χ²(1) = 21.4, p < .001). This potentially reflects a version of the 'mere exposure' effect, wherein more frequently-encountered stimuli are perceived more positively (Zajonc, 1968). This would indicate that emotion ratings at least partially reflect listener preferences and attitudes toward the music or the task demands, not only the music itself. Because of the high familiarity of the positive social emotions (particularly 'love'), the observed main effect for sociality might be spurious. Although the absolute ratings appeared to be affected by emotion word frequency, neither covariate seems to have impacted the absolute strength of emotion ratings.
Finally, monophonic stimuli again resulted in extreme emotion ratings more frequently than any other multiplicity level, replicating the finding from experiment one (logistic z = 7.76, p < .001).
Experiment 3: Emotion Rating Strength and Voice Denumerability
Results of the first two experiments indicate that as polyphonic textures thicken, negative emotion perception decreases while positive emotion perception increases. Additionally, the effect appears to taper off in a manner similar to limitations in voice denumerability, with 3-voice and 4-voice textures exhibiting smaller differences in emotion perception than 1- and 2-voice textures. This is consistent with the idea that perceptual voice numerosity mediates both responses.
However, this interpretation relies on denumeration data from separate studies using different stimuli and procedures: Huron (1989) and Parncutt (1993). To provide internal validity, experiment three endeavors to replicate Huron's polyphonic voice denumeration results using the current protocol. Additionally, we will attempt to bolster the external validity of emotion perception findings by using only the most expressive subset of stimuli and by allowing listeners to freely specify which emotions they perceive.
In order to make more refined predictions regarding voice denumerability, it is worthwhile to theorize possible perceptual or cognitive processes which could produce a subjective sense of voice numerosity or otherwise determine denumeration responses. First, listeners could estimate the number of voices, making approximate, nonsymbolic judgments of magnitude based on some feature of the sound, such as event density. Second, listeners might be able to quickly identify certain voice multiplicity levels without counting, in a process which has been called 'subitizing' in the context of vision and numeric cognition research (Jevons, 1871; Kaufman et al., 1949).7 Subitizing would seem most likely in a musical context for small voice multiplicities such as one or two. Third, listeners could deliberately count the number of voices by shifting their attention between perceived auditory streams (Bregman, 1971, 1990). A counting strategy could be facilitated by recognizing voice entries and exits, but need not rely on them exclusively.
Note that these processes differ as to the response profile they would be expected to produce with regard to central tendency (accuracy) and statistical dispersion (precision). For example, subitizing ought to have both high accuracy and high precision, as it represents a direct apprehension of the voice multiplicity. By contrast, estimation would be expected to be somewhat imprecise, and potentially systematically biased as well (e.g., Tversky & Kahneman, 1974). Counting processes could result in several response patterns, possibly depending on a listener's streaming capacity or their working memory. In general, one might expect counting responses to be reasonably precise, but potentially biased in one direction or another, depending on whether voices are actively entering or exiting the music.
Because they listened to music played from the beginning, listeners in Huron's denumeration study would presumably have had all three processes available; however, the current stimuli might not offer such flexibility. Huron's listeners would have been able to identify entries and exits, but the stimuli used here are isotextural, containing no voice entries or exits by design. The excerpts' short length could create further problems, as stream segregation appears to be cumulative (see Bregman, 1978): listeners tend to hear one stream at first before subsequently resolving more. In all, because our stimuli are both short and isotextural, counting would not be expected to be a successful strategy in the present denumeration task.
In addition to replicating Huron's results, experiment three tests the hypothesis that voice denumeration and emotion ratings will follow similar response patterns with regard to voice multiplicity. Additionally, we again tested whether monophonic stimuli would be more likely to evoke strong emotion ratings.
Procedure and Stimuli
Procedures were similar to those of the first two experiments, but attempted to minimize a possible design artifact due to nonexpressive musical excerpts: If listeners do not hear the music as emotionally expressive of the presented emotion (or any emotion for that matter), then their emotion ratings might have limited meaning. In order to ensure the fugues employed were sufficiently expressive, all 36 × 12 = 432 stimulus-emotion combinations from Experiment 2 were ranked in terms of their median rating's absolute deviation from the middle point of the scale. The rank sum of these deviations across each fugue's four multiplicity levels for all emotions was used as a measure of the fugue's expressivity. Of the nine fugues, the B minor, E major, C major, and B♭ minor fugues were selected as the most expressive.
Participants were undergraduates enrolled in sophomore-level aural skills classes and participated for course credit (N = 24, 10 females, 14 males, age 19–21). The study was divided into three parts: emotion generation, emotion rating, and denumeration. In the first part, subjects listened to four excerpts as many times as they wished. For each, subjects generated three emotion labels completing the sentence, "I hear _____ in the music." They subsequently chose the one emotion label which fit the excerpt the best. The four stimuli used to generate emotions represented each of the four fugues and each of the four voice multiplicity levels; each of the 24 subjects listened to one of the possible subsets of stimuli satisfying this constraint in random order.
The second part of the experiment employed the slider-rating paradigm as before, using the four listener-selected emotion labels in combination with the 16 different musical excerpts for 64 total randomized emotion-excerpt trials. In the third part, subjects denumerated the voices in excerpts by typing a single digit into an empty text field. All sixteen excerpts were presented twice, in two randomized blocks. Participants then completed the Ollen Musical Sophistication Index battery (Ollen, 2006).
Volunteered emotions were classified as 'positive', 'negative', or 'neutral / don't know' by an independent group of 6 raters. Emotions for which five of six raters agreed were grouped into valence categories for analysis.
Results and Discussion
| (a) Huron (1989) | |||||||
|---|---|---|---|---|---|---|---|
| 1 | 2 | 3 | 4 | 5 | 6 | ||
| Multiplicity | One | 309 | 6 | 15 | 0 | 3 | 0 |
| Two | 19 | 1368 | 63 | 1 | 0 | 0 | |
| Three | 0 | 127 | 1121 | 12 | 0 | 0 | |
| Four | 0 | 77 | 961 | 608 | 14 | 0 | |
| Five | 0 | 22 | 165 | 466 | 399 | 4 | |
| (b) Experiment 3 | |||||||
|---|---|---|---|---|---|---|---|
| 1 | 2 | 3 | 4 | 5 | 6 | ||
| Multiplicity | One | 185 | 6 | 0 | 0 | 0 | 0 |
| Two | 2 | 151 | 37 | 2 | 0 | 0 | |
| Three | 0 | 87 | 95 | 9 | 0 | 0 | |
| Four | 0 | 43 | 82 | 64 | 1 | 1 | |
Denumeration
Voice denumeration responses (Table 1) ranged from one to six voices, and the test-retest correlation between the two denumeration blocks was rs = .69. For each multiplicity level tested, listeners' most common voice denumerations matched those of Huron (1989), with the mode response in both studies being '1, 2, 3, 3' for the first four multiplicities. Average denumeration responses are quite concordant as well, with underreporting being much more common than overreporting (see Figure 7, top panel). Listeners with higher OMSI scores made fewer errors overall (logistic z = 2.10, p = .036).
We additionally tested whether the form of denumeration error types was concordant with Huron's results. To do so, the confusion matrices from each study were normalized by number of trials per multiplicity level, and denumerations greater than five were truncated. The probabilities of each incorrect response type in the confusion matrices (i.e., non-diagonal entries) were tested for statistical dependence using Kendall's tau. The patterns of erroneous responses were highly correlated, τ(16) = .713, p < .001, reflecting rank-order correspondence of both bias and dispersion effects between the studies.
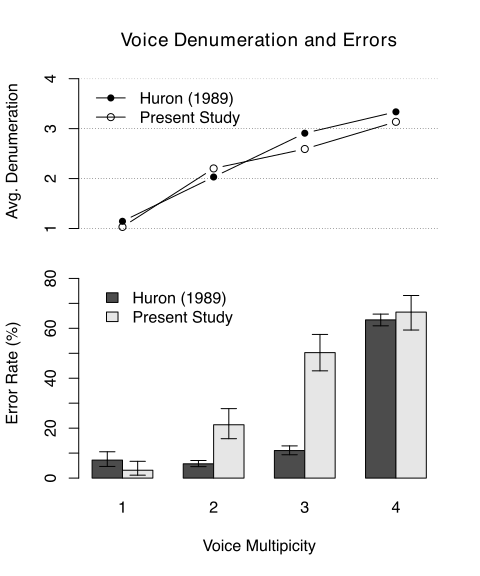
Despite this rank-order correlation, error rates in the present study were substantially higher for 2-voice and 3-voice stimuli than in Huron's previous results (Figure 7, bottom panel). This could reasonably be attributed to the aforementioned differences between the two tasks: while Huron's listeners would have been able to count voice entry and exits over a more typical listening experience, our subjects had only five seconds of music with no entries or exits.8 The uniformly high precision and accuracy for monophonic stimuli suggest that instant recognition (subitizing) might have occurred in both studies for one-voice textures. While Huron's listeners would have potentially been able to apply counting techniques to detect the entry of a second or third voice, our listeners were presumably much more likely to use estimation because the stimuli were isotextural. Finally, in both cases did listeners appear to resort to estimation processes when denumerating voices in four-part textures, resulting in very high error rates.
Emotion Perception
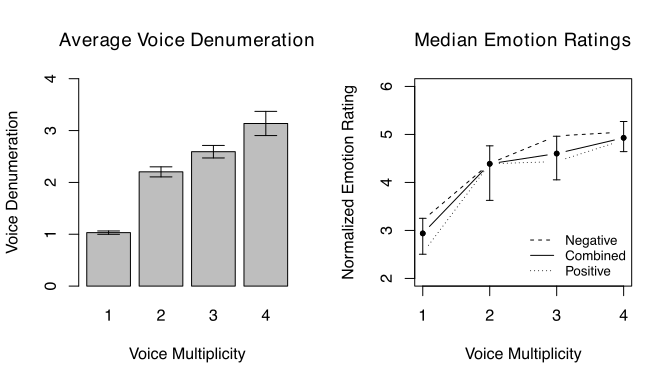
As predicted, positive emotion ratings increased with voice multiplicity while negative emotion ratings decreased, replicating the emotion valence effect identified in Experiment 2. Median positive and negative emotion ratings are displayed in Figure 8, with the negative emotion rating scale inverted to facilitate direct comparison. Qualitatively, it would appear that median emotion ratings do indeed follow a similar pattern to average voice denumeration outcomes. Both positive emotion ratings (r = .584) and negative emotions (r = −.558) were strongly correlated with average voice denumerations. As an inferential test, a linear model was used to predict normalized emotion ratings using a subject's first set of denumeration responses, blocking by subject and fugue. A main effect for voice denumeration was identified (χ²(5) = 120.1, p < .0001), consistent with the idea that the two tasks depend on the same information.
One could describe the similarity of denumeration and emotion responses as appearing biphasic: both seem to respond approximately linearly for voice multiplicities of two and higher, but monophonic stimuli are qualitatively different. This could correspond to estimation processes and subitizing, respectively.
Emotion Strength and Monophonicity
Our final hypothesis predicted that the proportion of strong emotion ratings would be highest for monophonic stimuli. Surprisingly, the probability that a listener would make a strong rating had no significant relationship with voice multiplicity in experiment three, failing to support the hypothesis (logistic z = −1.28, p = .2). It would appear that the previously-observed results in the first two experiments should be interpreted in light of the particular experimental task employed. Specifically, monophonic stimuli were associated with stronger emotion ratings when emotions were experimenter-provided, but not when they were listener-generated.
One might suppose that when participants were provided with emotion words in the first two experiments, these terms were understood as personal emotions describing affective experience or emotional expression of an individual. Perhaps monophonic stimuli were rated more strongly simply because they resemble a single person's voice. In this view, textures with more than one voice might have resembled multiple agents to which differing emotions could be attributed: hence, the emotional expression would be much less clearly defined. An alternative view would be that monophonic stimuli simply have fewer relationships present, making emotion perception more straightforward. There might also be attentional influences: unattended musical voices appear to influence the perception of attended musical voices (Davison & Banks, 2003; Fujioka, 2005). Regardless of the reason, it would seem that experimenter-provided emotion words led participants to seek melodies by which to judge emotional content.
By contrast, the third experiment requested that listeners provide their own emotion labels after listening to musical stimuli of all four multiplicity levels. These emotions might have been understood as musical emotions with specific musical meanings and referents. Thus, participants in experiment three might have been making ratings based on an excerpt's musical similarity to the one that initially evoked the emotion instead of to a more typical understanding of individually experienced or expressed emotions. Because emotion terms were generated for all four multiplicities, it is understandable why monophonic stimuli would not always evoke the strongest responses.
General Discussion
Overall, our results are consistent with the idea that textural density exerts a general influence on the perception of musical emotion, with thicker polyphonic textures associated with increased emotional positivity. The specific pattern of emotion responses appears to coincide with voice denumeration results, suggesting that both could depend in part on the same underlying percept: voice numerosity. While the relationship between voice denumeration and emotion ratings is correlational, their relationships to voice multiplicity appear to be causal.
Why might increased voice multiplicity be associated with positive emotions? A 'musical depiction' explanation would suggest that the music is interpreted as representing happy or otherwise positive social situations. Parties, dances, celebrations, ceremonies all occur in group settings marked by positive affect. On the other hand, one could also imagine instances where high voice numerosity would not necessarily be associated with positive affect, depending on the social or situational context. A traveling merchant would surely prefer to hear the sound of one marauding warrior instead of one hundred. Perhaps an opposite voice multiplicity effect would be expected for loud, aggressive, or threatening timbres.
An explanation based on musical depiction might incorporate some degree of cognitive appraisal of artistic communication, but this would not necessarily be required. One could instead conjecture that voice numerosity or related information is continuously used by humans as we monitor our auditory environment. Considered this way, it would not be unexpected if voice numerosity percepts directly lead to emotional responses much like other auditory information would. In such a way, implicit processes related to the interpretation of vocal signals might be expected to lead to evaluations of musical emotion.9
There are many reasons to believe that auditory voice numerosity percepts would be comforting to social organisms, provided that the vocalizations are nonthreatening. Many gregarious animals who live in groups for protection, foraging, or social interaction appear to use auditory signals known as 'contact calls' (or 'cohesion calls') to communicate their presence to conspecifics, including horses, cows, pigs, chickens, and primates. One could speculate that music is sometimes processed as though it were composed of human contact calls—sound made simply to communicate presence. In this view, any sound resembling several nonthreatening human voices would be perceived positively. Indeed, following the advent of recording technology, music seems to have become widespread in public spaces, with background music filling in socially dangerous silences, placating callers on hold, or calming early elevator passengers (Lanza, 2004).10
Numerosity Cues
If voice numerosity is indeed associated with more positive emotion perception, then one would expect that thicker musical textures ought to produce the effect only to the extent that they increase perceived voice numerosity. If so, then voice numerosity might be a third variable which could account for the conflicting results of Kastner and Crowder (1990) and Webster and Weir (2005), in which thicker textures were associated with decreased positivity. We will here suggest a broader conjecture concerning musical texture's emotional effects based on two possible musical numerosity cues: note density and onset density.
When hearing music, listeners might perceive textures in terms of the note density of the music, defined as the average number of individual notes occurring per unit time. As voice multiplicity rises, note density would be expected to increase.11 Perception of note density would depend on processing both synchronous and asynchronous note onsets (representing intervals and block chords on one hand and individual notes on the other). Another related musical feature would be temporal onset density: the number of event onsets per unit time, treating notes, intervals, and block chords as single temporal events.
Although note density would always be expected to increase as more voices are added to a texture, onset density might not. If an added melody is constrained to the same rhythm as the first melody, a homophonic musical texture results. In this case, onset density would be unchanged even as note density rises. On the other hand, if the added melody's notes do not coincide with any previously occupied metric positions, a polyphonic texture is formed, and onset density and note density rise identically. Hence, the degree of onset synchrony found in a piece could be used to measure its homophonicity (Huron, 1989a). The relationship between note density, onset density, and onset synchrony is shown in Figure 9 for the 36 excerpts used in experiment two.
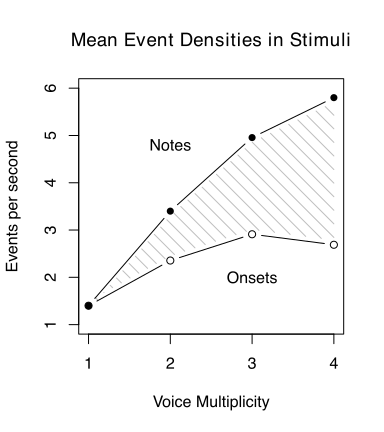
Knowledge of any two of note density, onset density, and onset synchrony would imply the third, and any could potentially be used to perceive or estimate how many voices are present. Specifically, polyphonic textures imply both high onset densities and low onset synchrony, which appear to increase listener ability to resolve individual voices (Rasch, 1981; Huron, 1993, 2001). Polyphonic textures would thus be expected to produce higher voice numerosity percepts due to their increased onset density. Notably, emotion ratings from experiment two appear to be more closely related to average onset density than average note density, because their greatest changes occurred between smaller voice multiplicities.12 One could therefore conjecture that subjective voice numerosity percepts might depend on musical onset density, so increased onset density ought to be associated with increased positivity of perceived emotion. Note that this conjecture concords with independent observations that greater rhythmic complexity and faster tempi are associated with positive valence.
If this is true, then the present stimuli might be most saliently distinguished from those of Kastner and Crowder (1990) and Webster and Weir (2005), because the present stimuli have high onset densities characteristic of polyphonic writing. This would lead to a comparatively higher perceptual voice numerosity. This feature seems to be shared by the accompaniments used by McCulloch (1999) and Gregory et al. (1996) which also led denser textures to be associated with more positive emotional valence.
While this would explain why the low onset density music used by Kastner and Crowder (1990) and Webster and Weir (2005) would not increase the music's valence, it does not immediately explain why these researchers would in fact have observed the opposite response: increased negative valence for thicker textures. A tentative reason could be proposed, however, based on the result from experiments one and two that monophonic stimuli evoke stronger ratings than thicker textures. Instead of using separate scales for 'happiness' and 'sadness', Webster and Weir (2005) asked listeners to use a single continuous valence scale from 'sad' to 'happy' to make their ratings. On the whole, their excerpts tended to be perceived on the positive side of the spectrum, with unharmonized melodies being perceived as more positive. While this could be interpreted as indicating that the harmonized melodies were perceived 'more negatively,' an alternative interpretation would be that the emotion ratings were simply more neutral ('less positive'), because the thicker homophonic texture sounded less like an individual voice, or otherwise obscured the melodic/prosodic cues listeners sought.
Future Directions
The observed effect of musical texture on voice denumeration and emotion perception would benefit from generalization to other musical styles, modes, composers, and instruments. Especially, one would want to more rigorously test the idea that voice numerosity per se mediates the emotion effect, rather than actual voice multiplicity. Direct means of manipulating and measuring the number of musical streams listeners are able to hear could be developed, potentially exploiting pseudopolyphony or interactions with the visual modality. The idea that homophonic music provides fewer numerosity cues than polyphony could be tested using specially constructed stimuli that independently manipulate note density, onset density, or onset synchrony. Specifically, the idea the onset density serves as a voice numerosity cue would be straightforward to verify experimentally.
Fundamental to the 'social organism' explanation is the idea that human speech sounds ought to produce a voice numerosity effect on perceived emotion similar to that of music. While intuitively appealing, this assumption must be subjected to empirical verification before it can be accepted. One could also determine whether spoken voice denumerability exhibits similar limitations to those for musical voices, or shares the proposed numerosity cue of onset density. One would hope to find these effects cross-culturally.
Finally, it appears that task demands and implicit effects play important roles in musical emotion rating paradigms. Much might be gained by carrying out several replications for any musical emotion study, each implementing a slightly modified protocol.
Notes
- In fact, the authors analyzed their data using a 'hit or miss' score depending on whether the emotion response was congruent with major-positive/minor-negative associations. That unaccompanied melodies were perceived more positively can be seen by reflecting the minor-mode results in their Figure 3 about the x-axis (Kastner & Crowder, 1990, p. 199). ↩
- A musical voice might even refer to imagined melodies that are not fully articulated, as occurs in pseudopolyphony (Davis, 2006). ↩
- This use of 'numerosity' roughly aligns with its use in the study of numerical cognition (Cheatham & White, 1954; White, 1963; Hoopen & Vos, 1979; Dehaene, 1997). ↩
- As Huron pointed out, this is reminiscent of the 'un, deux, trois, beaucoup' pattern of responses identified by Descoeudres (1921) in her studies of numerical cognition in children. However, as listeners often misidentified four voices as only three, perhaps 'one, two, many' would be more apt to describe polyphonic voice numerosity. ↩
- It was expected that the distinction between social and nonsocial emotion types would not be immediately evident to subjects. ↩
- Although the slider interface introduced ceiling and floor effects, these would be expected to reduce statistical power, increasing false negatives, not false positives. Model diagnostics indicated that residuals were well-behaved. ↩
- There is some debate as to whether subitizing in fact reflects a faculty distinct from counting. For present purposes, we treat it separately based on the rapidity with which it appears to operate. ↩
- Additionally, Huron's participants were five expert musicians, while our participants were undergraduate music students. Given that higher OMSI scores correlate with denumeration performance, this disparity could also be attributed to differences in skill. ↩
- In experiment two, emotion ratings were possibly affected simply by the familiarity of the emotion terms, suggesting that responses might at least be affected by implicit processes. ↩
- One could also argue that this state of affairs is not new at all: whistling, singing, humming, and instrumental performance could make music equally ubiquitous in nonindustrial cultures. ↩
- Although perhaps not strictly linearly: different voices might contain different numbers of notes (see Chapter 5). ↩
- In general, onset density cannot rise indefinitely as voices are added to metered music, because all metric positions will eventually be filled. ↩